Build Your Own Pro Marketing Dashboard with ChatGPT & SQL (Video Tutorial!)
Okay, here's a draft for a short blog post where you can embed your YouTube video. It complements the video's content and encourages viewers to watch.
Blog Post Title Options (Choose one):
- Build Your Own Pro Marketing Dashboard with ChatGPT & SQL (Video Tutorial!)
- Stop Paying for Dashboards: Let ChatGPT Create Yours (Easy Guide Inside)
- Unlock Custom Marketing Insights: AI-Powered Dashboard Tutorial (Even for Non-Techies!)
- From Prompt to Profit: Building (and Selling) Marketing Dashboards with ChatGPT
Blog Post Body:
(Posted: April 11, 2025)
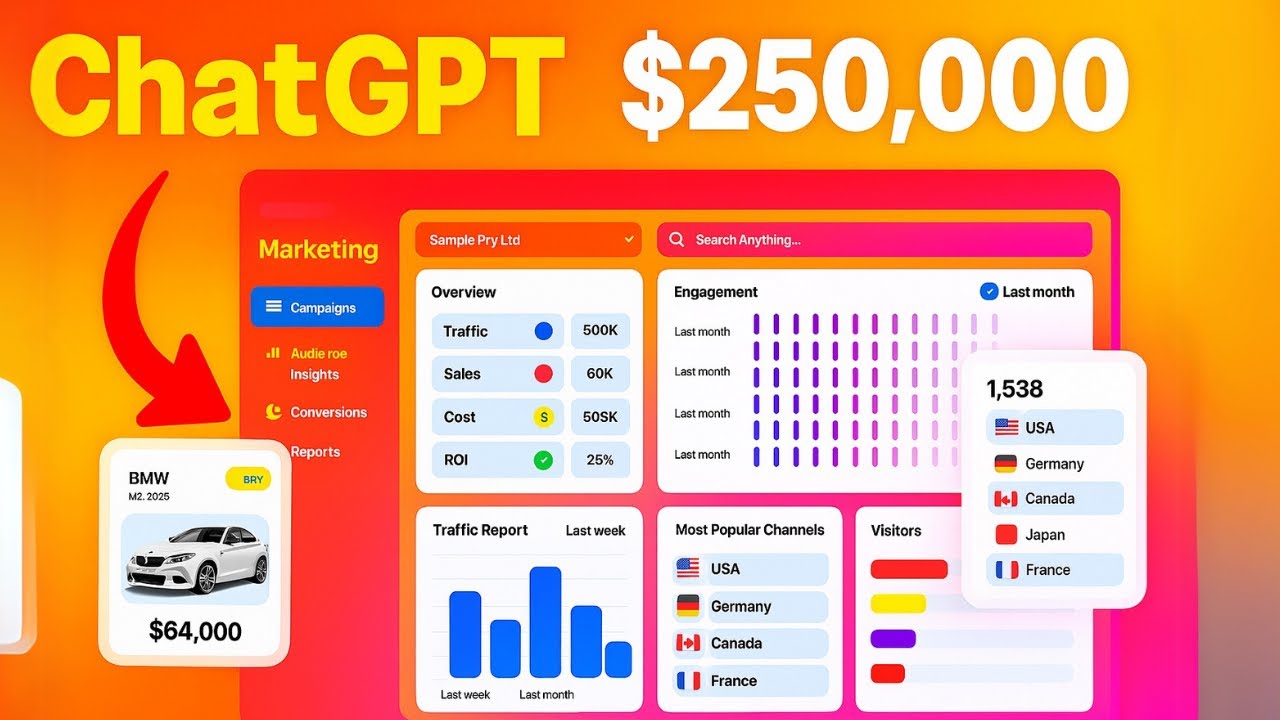
Are you tired of generic, expensive marketing analytics tools that don't quite fit your needs? Or perhaps you're a freelancer looking for a high-value service to offer clients? Imagine building a powerful, custom marketing dashboard that tracks exactly what you need – sales, ad spending, ROAS, ROI, campaign performance, Meta Ads conversions, and more – all without needing years of coding experience.
Sounds too good to be true? Not anymore! Thanks to advancements in AI like ChatGPT, creating sophisticated web applications, including data-driven dashboards, is more accessible than ever.
In the video tutorial embedded below, I walk you through the entire process, step-by-step. You'll learn how to:
- Use specific ChatGPT prompts (all provided!) to generate the necessary HTML, CSS, JavaScript (jQuery/AJAX), and PHP code.
- Structure a professional-looking dashboard interface.
- Set up a simple SQL database backend to store and retrieve your marketing data (like daily exports from Meta Ads).
- Visualize key metrics, track performance over time, and even add features like data export (CSV/PDF).
This isn't just about building a tool for yourself; it's about empowerment. Whether you're a marketer wanting deeper insights, a business owner needing clarity, or an aspiring freelancer, this method opens doors. We even touch upon how you could potentially package and sell these custom dashboards as a service or digital product!
Ready to dive in and build your own powerful marketing dashboard using AI? Watch the full tutorial right here:
Don't forget, all the ChatGPT prompts shown in the video are listed in the YouTube video description for easy copy-pasting.
Give it a try and see how easy it can be to transform raw data into actionable insights with the help of ChatGPT. Let me know in the comments below (or on the video) if you build your own dashboard – I'd love to hear about it!
--- **ChatGPT Prompts Used in This Video:** ---
(Prompt #1)
I will guide you to develop a dashboard step by step. First we need to create basic structure. At the bottom layer, there is a side navigation bar. Width 20 viewidth. 7 tabs in navigation bar. Use font awesome icons for each. First tab is dashboard that is the default. Last one is logout make it red. Make body and navigation bar background color black. And the top of the body, create the main section ( let it empty ). Make a radial gradient white background with sky blue and light green mixed color combination. Use rounded corners. Give me HTML CSS codes | I want you to act like the best analytics dashboard developer.
(Prompt #2)
let's update the code. want to create a professional header section in the top of the main section. container of the header should be blurry and semi transparent. create a name and menu tab, search tab and three icon tabs. at last create a profile tab in the right corner. let us add a image to that. balance container width using the width of name and search tabs. give me HTML and CSS codes. you don't want to provide full code. just guide me to place new codes into our project
(Prompt #3)
Divide rest of the main section into four containers. Apply same background as header. create total spending in the first container. Let others empty. There are four cards in the overview section. Total revenue, total reach, number of sales, ROAS. Beautify each section with fontawesome icons. Also get related results from the database. Get both data of this week and last week. Apply beautiful CSS. Give me HTML CSS js and PHP codes. Use $.ajax method.
(Prompt #4)
1. Now i want to have following cards for Meta Ads, Add to Cart, Check out, And also add graph for spending vs past period and revenue vs past period , i mean Visualize revenue, spending, sales over time.
(Prompt #5)
Add export buttons (CSV / PDF) Animate % change next to metrics Auto-refresh every minute Load real data from your database
(Prompt #6)
ok before i create the database, i want to share the template csv which i will export from meta reporting and upload on database, daily, or you share the solution,
(Prompt #7)
spending > Amount spent (PKR) revenue > Purchases conversion value sales > Purchases reach > Reach checkout > Checkouts Initiated add_to_cart >Adds to cart metric_date > Date (I will upload daily report and will have a date column with that)
 Like
1
Like
1
 Dislike
0
Dislike
0
 Love
0
Love
0
 Funny
0
Funny
0
 Wow
0
Wow
0
 Sad
0
Sad
0
 Angry
0
Angry
0
Enthusiast Young & Passionate Learner born in the 90s in Lahore, Pakistan. Digital Marketer & SEO expert by Profession & Bloggers by Passion.


Comments (0)